Agronometrics in Charts: USITC rules imported blueberries do not seriously injure U.S. industry
In this installment of the ‘Agronometrics In Charts’ series, Colin Fain illustrates how the U.S. market is evolving. Each week the series looks at a different horticultural commodity, focusing on a specific origin or topic visualizing the market factors that are driving change.
On Feb. 11 the U.S. International Trade Commission (USITC) determined that fresh, chilled, or frozen blueberries are not being imported into the United States in such increased quantities as to be a substantial cause of serious injury, or the threat of serious injury, to the domestic industry producing an article like or directly competitive with the imported article.
The determination was made in the context of an investigation initiated on September 29, 2020 at the request of the U.S. Trade Representative.
The Commission’s determination resulted from a 5-0 vote, and as a result, the investigation will end, and the Commission will not recommend a remedy to the President.
An affirmative vote could have eventually resulted in the imposition of trade barriers such as tariffs for imports of what has become one of the star products of the produce industry over recent years.
Making a Case Through Data
Although Agronometrics has not been a party to the proceedings, our team was involved from the beginning in making sure that both sides had accurate and reliable market data with which to build their arguments. To this end our services were commissioned by the International Blueberry Organization (IBO), making their members data available through a bespoke online application which we published on November 24th.
Agronometrics in Charts: IBO releases the blueberry data for the Americas.
At the same time, some of our customers referred our service to Dr. Prusa, an economist working on behalf of the Blueberry Coalition for Progress and Health, a trade group that opposes sanctions on imported blueberries.
Dr. Prusa’s efforts relied heavily on the data made available through Agronometrics. Some of his findings were highlighted in our article published on Jan. 12, 2021.
Agronometrics in Charts: Blueberry Coalition publishes analysis in response to ITC investigation
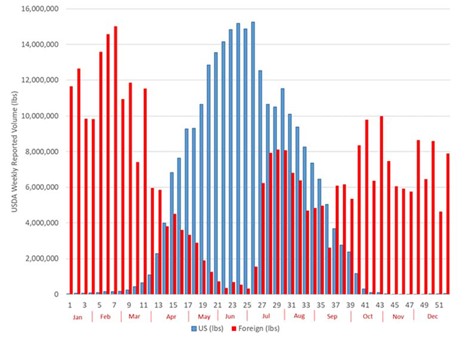
Figure 5 – Lack of Temporal Overlap of Supply (2019)
Source: USDA AMS Weekly Nonorganic & Organic Volume (“Movement”) Data (as compiled by Agronometrics); adjusted Canadian data (APHIS undercount)
At the hearing, it became evident that looking at weekly data was necessary to understand the industry. Dr. Prusa’s report reflected that, however, the study put together by the American Blueberry Growers Alliance, the trade group that was in favor of import restrictions, mostly aggregated data yearly.
As part of their post-hearing arguments, Capital Trade Inc, which was contracted by the Alliance, dug much deeper into the trade data counting again on Agronometrics to help them more easily navigate the USDA’s data. Some of their findings were featured in our article published on the 26th of January.
Agronometrics in Charts: The American Blueberry Alliance dives into market data for ITC Post Brief
Sources: US and Import Volume are from Agronometrics based on weekly Movement reports from the USDA Agricultural Marketing Service (AMS). US and Import Prices are from Agronometrics based in weekly Shipping Point reports from AMS, weighted by Movement volume. All prices in dollars per pound.
As mentioned at the beginning of the post, the arguments presented by the Blueberry Coalition for Progress and Health ultimately won out, with all five commissioners determining that there was no injury to domestic blueberry production from imports.
At the moment this is all we know. The findings will be presented to the President of the United States before being made public, which could take another 4 to 6 weeks.
In our ‘In Charts’ series, we work to tell some of the stories that are moving the industry. Feel free to take a look at the other articles by clicking here.
You can keep track of the markets daily through Agronometrics, a data visualization tool built to help the industry make sense of the huge amounts of data that professionals need to access to make informed decisions. If you found the information and the charts from this article useful, feel free to visit us at www.agronometrics.com where you can easily access these same graphs, or explore the other 20 fruits we currently track.
16/02/2021


